The Measurement Trap: Why Your Dashboard Lies About Revenue
Your dashboard can look healthy while revenue stays flat. Learn how to separate vanity metrics from buyer signals, diagnose GTM constraints, and build a scorecard that measures commercial movement.
THE GTM OPERATING SYSTEM
Dr. Rania Kuraa
5/19/20269 min read
In this article
What is the GTM measurement trap?
How the measurement trap forms
Vanity metrics vs. signal metrics
The three layers of damage
Why the measurement trap persists
How to rebuild the measurement layer
Build one shared GTM scorecard
The 10-minute GTM measurement audit
What to do this week
The system view
FAQ
Your metrics are green. Your pipeline is flat. Your board wants an explanation.
Marketing points to MQL volume, up 30%.
Demand generation points to webinar registrations, doubled since last quarter.
Content points to engagement rates that would make a social media manager weep with joy.
Everyone has a chart proving they did their job.
Revenue still did not move.
That’s the measurement trap.
It happens when a GTM team builds reporting around activity, then makes strategic decisions from numbers that do not connect to revenue.
What is the GTM measurement trap?
The GTM measurement trap happens when teams treat activity metrics as proof of commercial progress.
Leads, impressions, downloads, registrations, and email opens can help teams understand execution.
They cannot tell you whether buyers are moving, opportunities are progressing, or revenue is growing.
The problem is not that activity metrics are useless.
The problem starts when they become the strategy scorecard.
How the Trap Forms
The measurement trap doesn't start with bad intentions.
It starts with a reasonable question:
"How do we prove marketing works?"
That question creates pressure.
Marketing needs numbers. Fast.
So the team picks metrics it can control and move quickly:
Leads generated
Email open rates
Social impressions
Webinar attendance
Content downloads
Website traffic
These numbers go up if you work hard.
They look good on slides.
They're easy to track.
The problem is that none of them measure whether the market is actually buying.
A lead is not pipeline.
An open is not intent.
A download is not demand.
That doesn’t mean activity metrics are useless. It means they’re being promoted to the wrong job.
A vanity metric tells you something happened on your side.
A signal metric tells you something changed in the buyer’s behavior.
Downloads, opens, pageviews, impressions, and registrations can help teams tune execution.
Demo requests, sales-accepted opportunities, stage progression, pipeline velocity, and revenue movement help teams make strategic decisions.
The trap starts when vanity metrics become the strategy scorecard.
But once these metrics become the reporting standard, the team starts optimizing for them.
Not because anyone decided activity matters more than revenue.
Because the measurement system made activity the only thing visible.
Vanity metrics vs. signal metrics
A vanity metric tells you something happened on your side.
A signal metric tells you something changed in buyer behavior.
Use vanity metrics to tune execution
Examples include:
Opens
Clicks
Pageviews
Impressions
Registrations
Content downloads
Social engagement
These metrics help you improve copy, targeting, format choices, and channel execution.
They belong in operational reviews.
Use signal metrics to make strategic decisions
Examples include:
Demo requests
Sales-accepted opportunities
Stage progression
Stage-to-stage conversion
Pipeline velocity
Win rate
Revenue movement
These metrics help you understand whether the GTM system creates commercial progress.
They belong in strategic reviews.
The mistake is not tracking vanity metrics.
The mistake is treating them like revenue metrics.
Forrester’s 2024 Marketing Survey makes the issue hard to ignore: 64% of B2B marketing leaders said they did not trust their organization’s marketing measurement for decision-making, and 61% said their measurement and analytics did not align well with organizational objectives or growth strategies.
Forrester also found that 59% of CMO dashboards tracked some form of sourcing metric, even though sourcing metrics do not explain how B2B demand develops or how buying groups move.
That is the trap.
Teams keep measuring who “sourced” pipeline instead of measuring how marketing helps buyers progress through the revenue system.
Think of it like a restaurant that measures success by how many people read the menu.
Reading the menu is nice.
Ordering dinner is the business.
If you optimize for menu-readers, you will design a beautiful menu and wonder why the kitchen is quiet.
That is most B2B marketing dashboards: beautiful menus, quiet kitchens.
The three layers of damage
The measurement trap does more than waste reporting time.
It corrupts decisions across the GTM system.
1. Misallocation
When you measure the wrong things, you fund the wrong things.
A channel that generates 500 MQLs and zero pipeline can look stronger than a channel that generates 30 leads and 12 qualified opportunities.
The dashboard rewards volume.
The budget follows volume.
The channel creating revenue gets cut because it “underperforms” against the metric the team chose to track.
Gartner’s 2025 Tech Marketing Benchmarks Survey shows why measurement quality matters: tech marketers face pressure to assess investments, justify funding against corporate and sales objectives, and use benchmark data to guide planning and budget allocation.
If your dashboard captures activity but not revenue movement, you do not just report the wrong story.
You fund the wrong system.
2. False confidence
Green dashboards create a dangerous illusion.
Leadership sees growing MQLs, rising engagement, and expanding reach.
The system looks healthy.
Nobody asks whether those numbers turn into pipeline until the quarter ends short.
By then, the data cannot help you adjust targeting, change the message, or reallocate budget.
The measurement trap turns a 90-day problem into a 90-day surprise.
You find out you are off track on day 89 instead of day 15.
3. Team dysfunction
When Marketing measures leads and Sales measures revenue, the two teams live in different realities.
Marketing reports a strong quarter.
Sales reports a weak one.
Both teams are telling the truth.
Both teams are looking at a different part of the same broken system.
This is where alignment meetings go to die.
You cannot align two teams staring at different scorecards.
They argue about whose numbers are right instead of fixing the system producing those numbers.
Why the measurement trap persists
If the trap is this visible, why do smart teams stay stuck in it?
Three reasons.
1. Vanity metrics are comfortable
They go up.
They look good on slides.
They give leadership a clean story to tell the board.
Replacing them with revenue-connected metrics means replacing a green dashboard with an honest one.
Honest dashboards expose gaps.
2. The tooling reinforces the trap
Marketing automation platforms default to MQLs.
CRMs track leads by source.
Reporting tools build dashboards around volume and engagement.
Activity is easy to instrument.
Revenue flow requires connected data, shared ownership, and someone willing to manage the integration layer.
3. Incentives reward the wrong behavior
If the CMO’s bonus ties to MQL targets, the team will hit MQL targets.
If demand generation gets evaluated on webinar registrations, registrations will grow.
If content gets measured by publishing volume, the calendar will stay full.
Incentives do not create strategy.
They create behavior.
How to rebuild the measurement layer
The fix is not to throw out every metric and start over.
The fix is to restructure what you measure so the numbers tell you whether the system works, not just whether the team stays busy.
1. Separate operational metrics from strategic metrics
You don't need to stop tracking activity metrics.
You need to stop using them for decisions they cannot support.
Use opens, clicks, impressions, and downloads to tune execution.
Use pipeline created, sales acceptance, velocity, win rate, and revenue movement to make strategic decisions.
2. Measure the system, not the silos
Most teams measure Marketing’s piece, then Sales’ piece, then wonder why the overall number does not add up.
Start measuring throughput.
Track three numbers at each stage:
Volume
Velocity
Conversion
Those numbers tell you where the constraint lives.
If volume is high but conversion is low, your qualification criteria or handoff process need work.
If velocity slows at a specific stage, friction exists inside that decision point.
If conversion is healthy but volume is thin, you have a demand problem.
BCG’s 2025 marketing measurement research points to the same operating principle: leading teams align KPIs to business outcomes, connect measurement across planning and optimization, and define decision rights across the organization.
The shift is simple:
Fewer isolated metrics.
More visibility into flow.
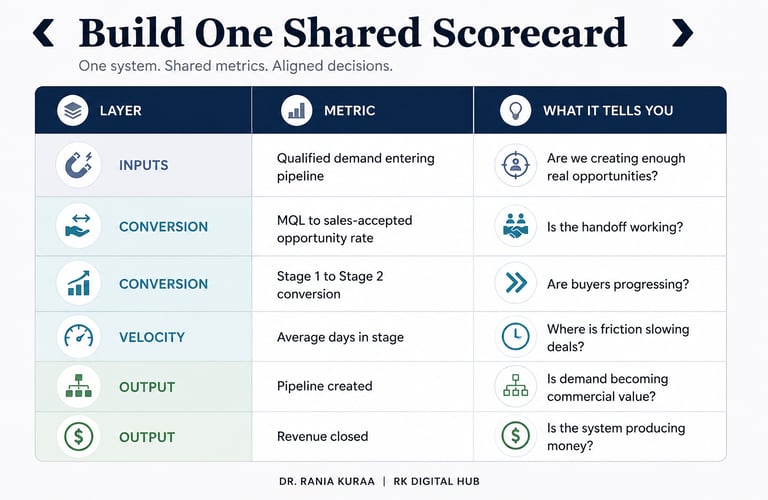
3. Build one shared scorecard
Marketing and sales should look at the same dashboard in the same meeting.
Not "marketing's dashboard" and then "sales' dashboard."
One scorecard with three sections:
Inputs
Track:
Demand generated
Qualified accounts entering the pipeline
Sales-accepted leads or opportunities
Pipeline created by segment
Conversion
Track:
Stage-to-stage movement
Marketing-to-Sales handoff conversion
Opportunity progression
Velocity by segment
Drop-off points
Outputs
Track:
Pipeline created
Revenue closed
Win rate
Average deal cycle
Expansion revenue
When both teams see the same numbers, the conversation shifts from blame to diagnosis.
That changes the meeting.
Instead of asking:
Who missed the target?
The team asks:
Where is the constraint?
That is a much more useful conversation.
A useful GTM scorecard doesn’t need 40 metrics. It needs one clean view of flow. If one number breaks, you know where to look.
4. Tie incentives to revenue-connected metrics
This is the hardest change because it requires executive commitment.
If marketing's KPIs still center on MQL volume, the team will keep optimizing for volume regardless of what the new dashboard says.
Move the CMO's primary metric to pipeline contribution.
Move demand gen's metric to qualified pipeline created (not leads generated).
Move content's metric to content-influenced revenue (not pageviews).
You don't have to do this all at once.
Pick one metric per team. Shift it. Let the behavior follow.
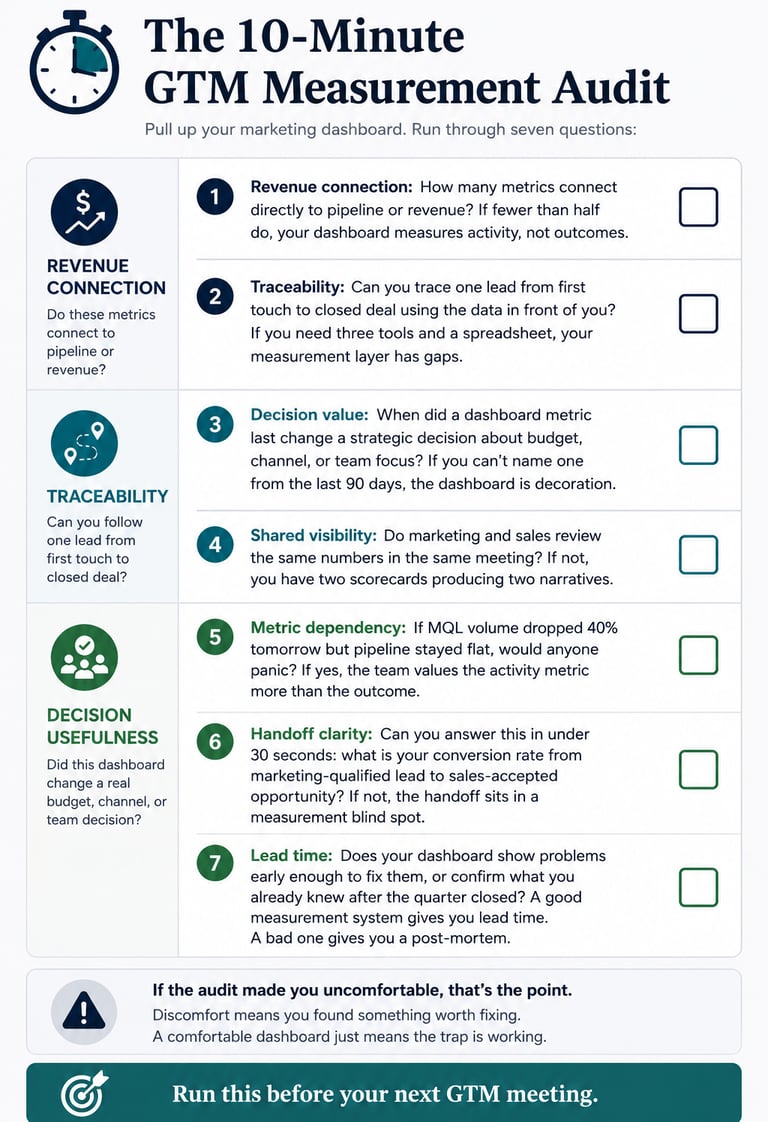
The 10-minute GTM measurement audit
Pull up your marketing dashboard.
Run through these seven questions before your next GTM meeting.
The seven audit questions
Revenue connection: Do your reported metrics connect directly to pipeline or revenue?
Traceability: Can you follow one lead from first touch to closed deal using the data in front of you?
Decision value: Has a dashboard metric changed a real budget, channel, or team decision in the last 90 days?
Shared visibility: Do Marketing and Sales review the same numbers in the same meeting?
Metric dependency: If MQL volume dropped but pipeline stayed unchanged, would the team still panic?
Handoff clarity: Can you state the conversion rate from marketing-qualified lead to sales-accepted opportunity in under 30 seconds?
Lead time: Does your dashboard expose problems early enough to fix them before the quarter closes?
A useful dashboard should help you understand whether the revenue system is working, where momentum breaks down, and which decision needs to change next.
Use the audit below to identify the gaps.
Use this audit before your next GTM meeting to identify whether your dashboard measures commercial movement or simply reports activity.
What to Do This Week
You don't need a six-month measurement transformation.
Start with three moves.
1. Label your top five metrics
Classify each one:
Operational
Strategic
Vanity
Signal
Be honest.
If the metric measures your team’s output but not buyer movement, it should not drive strategy.
2. Schedule one shared dashboard meeting
Marketing and Sales review the same screen.
Not “Marketing presents, then Sales presents.”
One scorecard.
Shared numbers.
The first meeting will feel uncomfortable.
That discomfort is the sound of two teams looking at the same system.
3. Add one throughput metric
Track stage-to-stage conversion at the Marketing-to-Sales handoff for four weeks.
Just one number.
It will teach you more about the health of your GTM system than a dashboard full of decorative confetti.
The system view
Revenue is a system.
Inputs.
Conversion.
Distribution.
Feedback.
Measure the pieces in isolation, and you optimize fragments.
Measure the system, and you optimize flow.
Most GTM teams do not have a demand problem.
They have a visibility problem disguised as one.
They do not need more leads.
They need a clearer view of whether the leads they already have turn into money.
Fix the measurement layer, and two things happen:
You stop wasting budget on activity that does not connect to pipeline.
You start seeing problems early enough to fix them.
Your dashboard should make you uncomfortable on the right days.
If it only makes you comfortable, it is lying.
FAQ
What is the GTM measurement trap?
The GTM measurement trap happens when teams use activity metrics, such as leads, clicks, and downloads, as proof of commercial progress. These metrics can help tune execution, but they do not show whether buyers move or revenue grows.
Are vanity metrics useless?
No. Vanity metrics aren’t entirely useless. They help teams improve campaigns, content, and channel execution. The problem starts when teams use them to make strategic revenue decisions.
What is the difference between an operational metric and a strategic metric?
Operational metrics help teams improve day-to-day execution. Strategic metrics show whether the GTM system creates pipeline, accelerates opportunities, and generates revenue.
Which metrics should a GTM dashboard include?
A GTM dashboard should include qualified pipeline created, sales acceptance, stage-to-stage conversion, pipeline velocity, win rate, average deal cycle, and revenue movement.
Why are MQLs not enough?
MQLs show that a lead met a defined threshold. They do not prove Sales accepts the lead, the account fits the market, or the opportunity will progress.
What is a shared GTM scorecard?
A shared GTM scorecard gives Marketing and Sales one view of inputs, conversion, and outputs. It helps teams diagnose constraints instead of arguing about separate metrics.
How do you measure content impact without perfect attribution?
Track whether Sales uses the content inside active opportunities, whether the right accounts engage with it, whether it supports stage progression, and whether it helps reduce buyer friction.
How can a team improve GTM measurement quickly?
Start with one shared scorecard, classify your top metrics, and add one throughput metric at the Marketing-to-Sales handoff.
Is your dashboard measuring activity, or helping you grow revenue?
If your metrics are green but pipeline stays flat, the problem is not reporting volume.
It is the measurement layer underneath your GTM system.
A GTM Audit helps you identify the gaps across positioning, revenue messaging, buyer episodes, handoffs, measurement, and content governance, so you can see where revenue flow breaks down and what to fix first.
Sources
Forrester, B2B Marketing Leaders Don’t Trust Their Measurement, And What They Measure Isn’t Helping, 2024.
Forrester, B2B Marketers: It’s Time To Ditch Sourcing Metrics, 2022.
Gartner, 2025 Tech Marketing Benchmarks Survey, 2025.
BCG, Six Steps to More Effective Marketing Measurement, 2025.
About The Author
Dr. Rania Kuraa
Dr. Rania Kuraa is the Founder & CEO of RK Digital Hub. She helps B2B tech, SaaS, and professional services companies scale from $1M to $10M ARR by fixing GTM gaps across positioning, pipeline, content systems, and revenue execution.
This article is part of The GTM Operating System, a weekly series on revenue architecture, GTM gaps, and content systems for B2B growth teams.